The general requirements for creating great graphs are just the same as creating great writing – The graphs should be well arranged, succinct, free of fluff, and compelling. The last one is the most important. And it’s just as well. Because a well-made graph can convey a whole data set successfully in as quick as three seconds. And diagrams are perfect to share on social media. Even if a person is just too lazy to share a whole, lengthy article, they may choose to share a particularly significant graph.
The days where you need to gather an entire graphics team to make one graph are long gone. With the help of technology, there are graphing tools for crafting graphs and infographics ready to assist you to visually bring your graph to life as long as you have the information to put in.
Today let us check out 11 tools that are most employed in daily graphing designs.
1. DesignBold
Regardless of your business – whether you need to make a perfect poster, postcard, social media graphic, presentation, or whatever else, you can easily craft these materials with DesignBold. This is one of the simplest design tools, which gives you access to pretty design resources – in which, countless images, fonts, document formats, and professional layouts are available for you to freely pick.
With DesignBold, the user can easily and speedily edit their photos using the preset filters. Or they can get advanced and be more creative with professional photo editing tools such as contrast, saturation, brightness, etc. from the simplest, one-click edit to the most complicated.
2. Google Charts
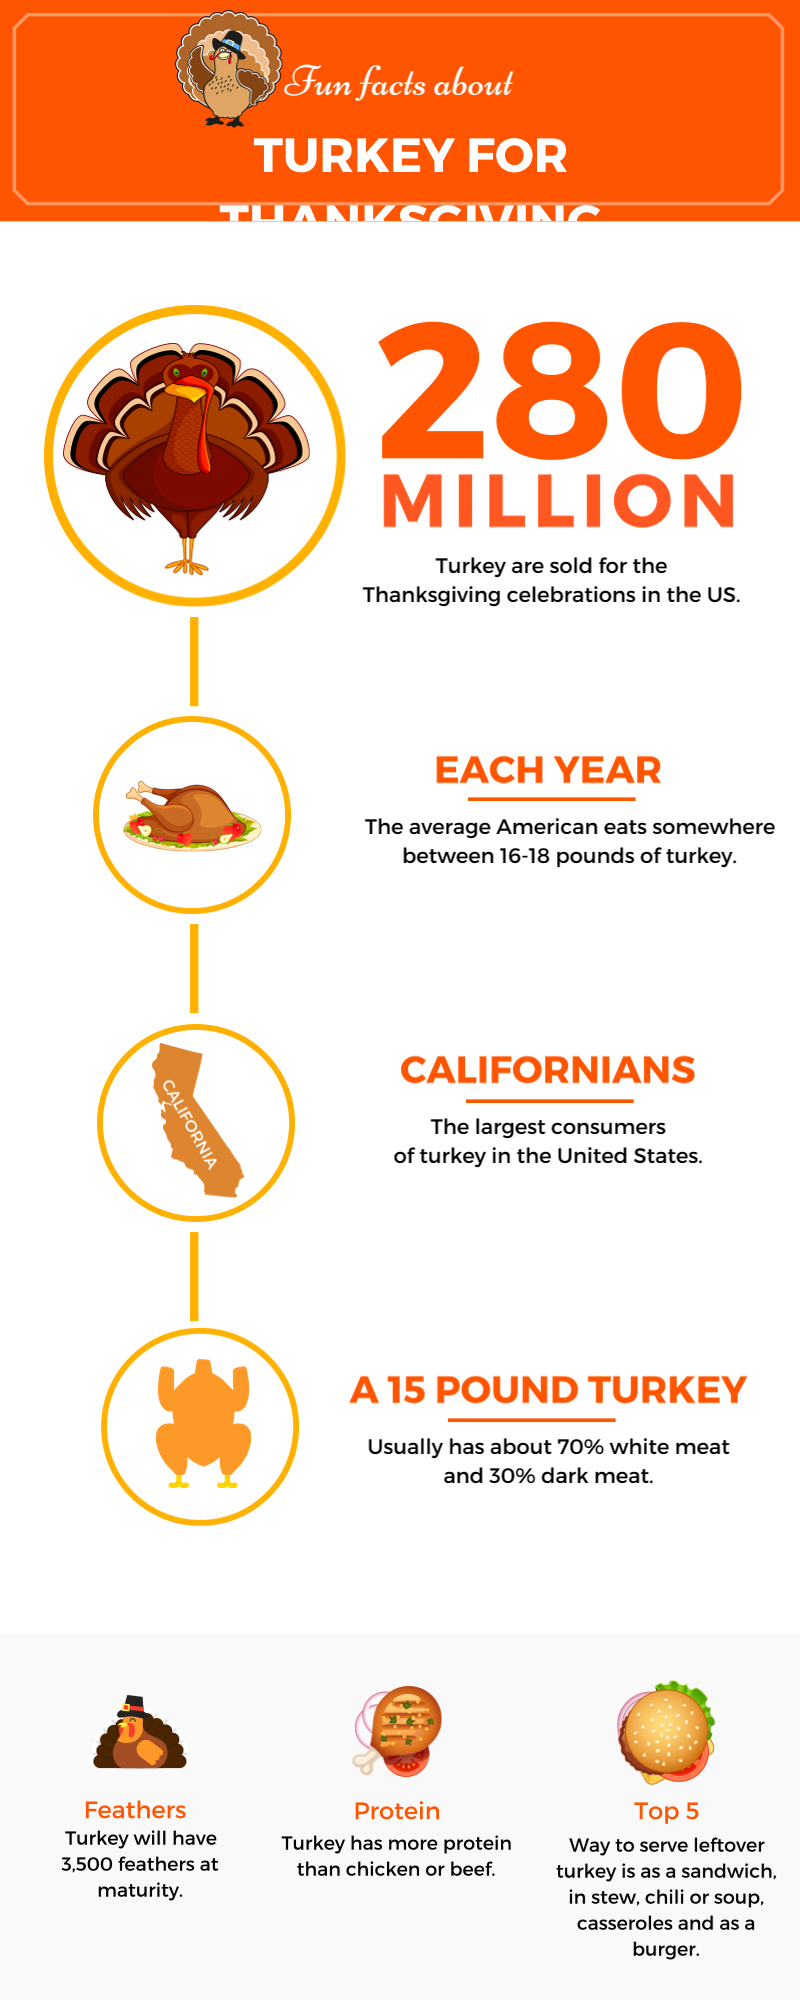
Google Charts is a free graphing tool that offers a selection of ready-to-use graph types, from simplest ones like line graphs to more complex kinds like timelines and geographical maps.
Users of Google Charts can also make QR codes, pointers, as well as other visual tools too, to customize photos and directly upload all of them to your website.
3. Augl
Augl allows you to turn spreadsheets – which can be CSV or Google Sheets – into mobile-optimized visualizations or diagrams that can be shared easily. The interface of Augl is extremely simple. All users need to do is to import a file and leave the rest to Augl — It will convert the data into cards, which you can later turn into visualizations.
4. Many Eyes
The prestige IBM created this free graphing tool to help you sort your data out or build visuals as part of a presentation or larger project of infographics. With quite simple designs, Many Eyes gives users a collection of pre-determined visualization functions in accordance with what data type the users have. These functions include word trees, maps, pie charts, word generators, tag clouds, blank graph, etc.
5. Chartblocks
Chartblocks’ duty is to alter the code with the user’s graph designer – which guides them through the whole process, so the users can easily use it. There are 2 version of Chartblocks: the free version and the paid version. With the former version, all users can create up to 30 graphs and export the finished graphs as PNG files. The small disadvantage of this version is that there’s no vector graphics and you can’t set your graphs private.
6. Beam
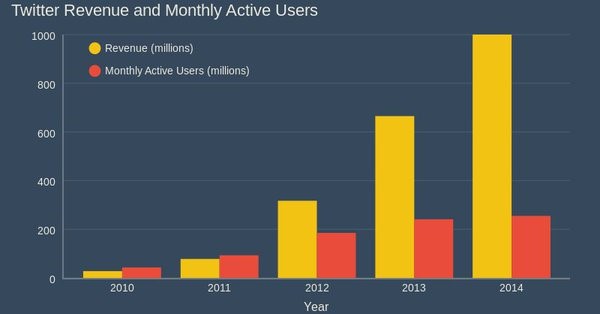
Beam is a free chart maker to build fine data visualizations. Beam can craft a wide range of beautiful diagrams – including bar charts, pie charts, line charts, in a matter of seconds. Beam also lets you pick from various color themes so you can be creative and make your own unique, data-rich visualizations without any stress.
7. Charted
Come to Charted if all you need is making simple diagrams like line graphs, bar graphs, or stacked bar charts. Also, Charted can be your wonderful bar graph maker if you have data that looks best represented in one of those chart types. Not many tools are easier visualization than Charted.
All you need to do is to paste the link to a file (note that Charted supports Google Spreadsheets and file with .csv, .tsv format), then get your chart.
8. Chartist.js
If you need a diagram for a deadline due by later today, come to Chartist.js. By using the CSS files of Chartist.js, you’ll get a graph done really fast with the creative animations and free data visualization.
9. Vennage
The social analytics – marketing company Vennage provides infographics and other graphing designs included in its service package. The tool is ideal for making infographics allows users to select from a varied collection of customizable themes or to upload their own pictures and backgrounds from their PC.
10. Vizzlo
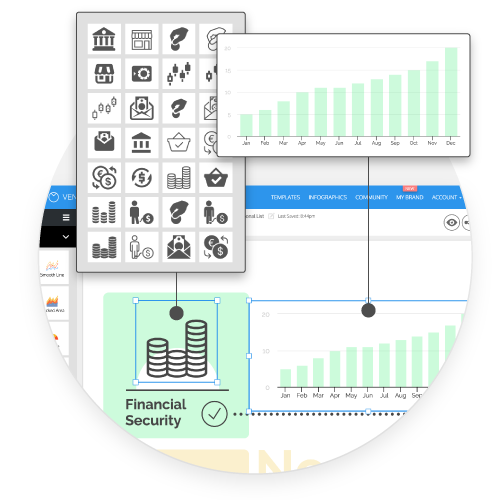
Vizzlo offers all users a free option including up to 100 diagram types so that the user can grab some notion of the way this graphing tool functions. Specifically, more than 100 available templates the free version of Vizzlo allows you to pick from are about:
- Maps
- Gantt-charts
- Venn diagrams
- Timelines
- Process diagrams
- Milestone plans
- Other graphic presentations of data
If you want to generate professional diagrams without the site’s watermark, you’ll need to consider registering Vizzlo’s premium version with a specific amount of fee. But it’s worth it since this version lets you download your finished graphics in the form of shareable files (PDFs) with adjusting options.
11. Edraw Infographic
Now this is a rare noteworthy represent from the group of offline graphing tools – the Edraw infographic software. As said, the software lets you create infographics offline. The huge advantage here is that Edraw infographic doesn’t take time to load icons and symbols like its cousins the online programs.
Also, Edraw infographic includes wondrously powerful options for building highly personalized infographics. You can easily make, edit, print, and share the infographics like true graph masters.
Conclusion
Each software above has its own strengths and weaknesses. The point is which one will suit your needs most. Let’s us know which tool you choose to create powerful graphs, charts and diagrams by leaving your comments below. Thank you and we’ll see you in our future posts!
