
The problem here is, how to convey as much info to your audience as possible with a graph as your assistance. So, long story short, there are two fundamental factors contributing to a successful presentation: yourself and your graph.
In this today’s article, we won’t discuss how to design powerful graphs. Instead, we will focus on how to make attractive presentation with these graphs. Let’s get started!
Mind Your Audiences
This is your duty and role as the presenter to find the most optimal way to explain the statistics to the spectators. You don’t really have to put yourself in their shoes, but you should certainly be able to answer as correctly as possible these questions:
- What do your audiences expect to hear?
- What do your audiences already know?
- Things you need to cover?
- What is interesting enough to keep your audiences focused?

Ask yourself and find the answers to boil the info in your graphs down to those that are most essentials. In your presentation, make a good talk with these tips:
- Know the content of your presentation inside out
- Speak with confidence and with an easy bearing
- Speak loudly, clearly, and deliberately
- Maintain eye contact with the audience
- Focus on your presentation and don’t try to interpret the audiences’ looks
Identify the Graph Type
Defining which graph to use for which type of data is crucial. Remember to think of what kind of chart you should employ for the content you have at hand. Here are some most used charts you usually see in most presentations:
Line Graph
A line graph is most useful for demonstrating trends or progress over a period of time. It can be employed to show different data categories.
Line graphs work by simply using a line to connect your plotted points of statistic data. You can use this type when you’re going to map a continuous data set.
Column Chart
Column charts are used to depict a comparison of different categories, or a comparison of different categories over time.
Bar Graph
Bar graphs are essentially horizontal column charts. People often used this format to avoid clutter in cases:
- The label of one data is too long
- Compare more than 10 items
- Display negative statistics
- Show discontinuous data
Stacked Bar Chart
Somewhat similar to plain bar graphs, this type of graph should be employed when:
- You want to compare many different categories
- You want to display the composition of each category being compared
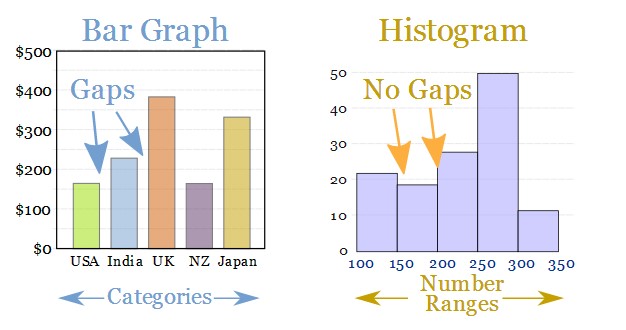
Histogram
This is another kind of chart that also contains columns in its appearance. For this very reason, people get confused between histograms and bar graphs from time to time. For easier discrimination, bar charts have gaps between each column, while histograms have none.
A histogram is usually used when:
- The data type you have is quantitative data
- You want to show info that is used for statistics
The value ranges are placed at the bottom and are named “classes”. The taller the columns, the greater the frequencies represented.
Pie Chart
A pie chart is used to show:
- A static number
- How items represent sections of a whole (i.e., something’s compositions)
Remember this when you want to use pie charts for your presentation:
- Pie charts represent statistics in percentages
- The final sum of all sections must equal 100%
That’s why, if you want to employ pie charts, the measured data must demonstrate a percentage or ratio relationship. And presenters must always use the same measurement unit within the diagram, lest the numbers become inconsistent and meaningless.
Create the Graph
When you’re clear about the type of graph you’ll be using, it’s time to create an appropriate one with such a design so that it may add great value, as well as improve the precision and efficiency of your communication.
The Font
It’s very important to make sure that all data is legible. You can contribute to this by avoiding unnecessary 3D effects or fancy animations.
Excel’s own default typeface is inherently resourceful and quite easy to read. So, you can either use the default font (though it may be a little bland) or choose your own one. The latter allows you to take control of any significant element of the graph’s appearance.
You can change the typeface used for various elements of your graph by either (or both) highlighting each piece of text and/or selecting another font available in the Ribbon. But all in all, you need to keep the selected font consistent across your whole visualization.
The Color
Adding color to brighten up your chart is advisable, but too colorful can be problematic. So, don’t overuse it or you’ll overload your data. Instead, you should:
- Highlight your examples and messages by matching colors for the design
- Find the shade that can work best with your chosen theme with a specialized color palette
Be Flexible
When it comes to working with data, you don’t have to use one type of graph throughout your presentation strictly. Rather, you can add different types in your presentation.
However, the graphs are used only as a design element. Specifically, they’re to decorate your speaking and are something for the audiences to pay attention to. So here are what you need to put in mind:
- Don’t overuse or use too many graphs – it may overwhelm the spectators with lots of statistics.
- Employ different kinds of graphs sparingly.
- Only use graphs when they can add value to your next speech.
You can create a nice graph of most kinds with MS Excel. But better, you should take advantage of a reliable online graph maker, such as Designbold. This convenient tool offers a variety of pre-made templates of all kinds of graphs, charts and diagrams for you. Especially, most of them are free to use. So simply choose one template and customize it as you wish!